Yield curves

The Bank of England publishes daily estimated yield curves for the UK

Overview

We produce two types of estimated yield curves for the UK on a daily basis:   

  1. A set based on yields on UK government bonds (also known as gilts). This includes nominal and real yield curves and the implied inflation term structure for the UK.
  2. A set based on sterling overnight index swap (OIS) rates. These are instruments that settle on overnight unsecured interest rates (the SONIA rate in the UK). OIS curves are for nominal rates only.

We aim to publish the latest daily yield curves by noon on the following business day.  

Archive data is also available on a third set of curves based on instruments linked to sterling interbank rates (LIBOR). These commercial bank liability curves are nominal only and were discontinued at the end of 2021 in line with the cessation and loss of representativeness of the LIBOR benchmarks.

Any updates to archive yield curve data are made available by close of business of the second working day of each month.

Latest yield curve data 

Yield curve terminology and concepts

Commercial bank liability curve: Quarterly Bulletin article

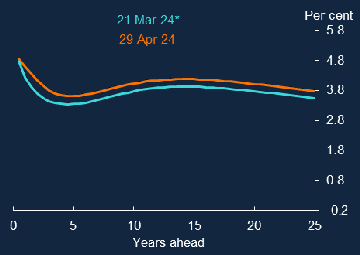
UK instantaneous nominal forward curve (gilts)

* The curve on the day of the previous MPC meeting is provided as reference point
Sources: Bloomberg Finance L.P., Tradeweb and Bank calculations

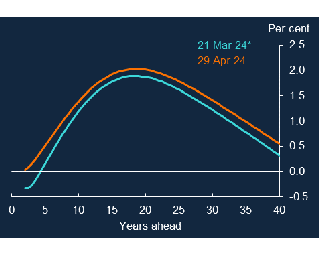
UK instantaneous implied real forward curve (gilts)

* The curve on the day of the previous MPC meeting is provided as reference point
Sources: Bloomberg Finance L.P., Tradeweb and Bank calculations

No methodological change has been implemented following the conclusion of the consultation on reform to RPI methodology, published as part of the 2020 Spending Review. The UKSA proposal to align methods and data sources of RPI to CPIH in February 2030 is likely to impact the fitting of the curve around this point.

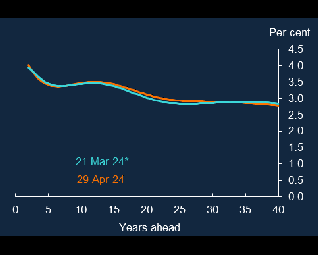
UK instantaneous implied inflation forward curve (gilts)

* The curve on the day of the previous MPC meeting is provided as reference point
Sources: Bloomberg Finance L.P., Tradeweb and Bank calculations

No methodological change has been implemented following the conclusion of the consultation on reform to RPI methodology, published as part of the 2020 Spending Review. The UKSA proposal to align methods and data sources of RPI to CPIH in February 2030 is likely to impact the fitting of the curve around this point.

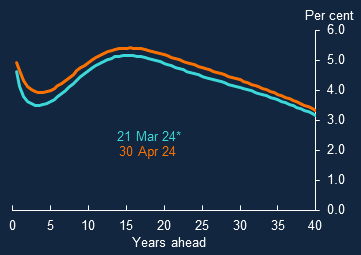
UK instantaneous nominal forward curve (overnight index swaps)

* The curve on the day of the previous MPC meeting is provided as reference point 
Sources: Bloomberg Finance L.P. and Bank calculations

Frequently asked questions about yield curves

If you are having problems viewing up-to-date data, please see our frequently asked questions below for help on fixing the problem.

If you any further queries relating to data quality or you are experiencing technical issues, email: yield.curve@bankofengland.co.uk.

We aim to respond within five working days.

Data availability

  • Please refer to our copyright/disclaimer. Providing that the data were used according to the conditions listed on that page, there would be no objection to electronic storage. Please be aware however, that data are subject to revisions and the latest data will be available on our website.   
  • Our yield curve data are not available over an API.
  • A good source for this kind of historical data is the book by F Capie and A Webber, 'A Monetary History of the United Kingdom 1870-1982', published by Routledge. Alternatively a good web source is Global Financial Data.
  • The ECB homepage has nominal yield curve data for the euro area. The Federal Reserve Board's homepages contain nominal and real yield curve data for the US. 
  • The commercial bank liability curves were discontinued at the end of 2021 in line with the cessation and loss of representativeness of the LIBOR benchmarks.  We would suggest using the OIS curves from now on. We decided to extend the range of published OIS curve maturities (from 5 to 25 years) in late 2021 as our market contacts reported that the transition away from LIBOR benchmarks towards SONIA had improved liquidity in longer term OIS rates.
  • The start and end points of our estimated curves depend on the shortest and longest market instruments for which reliable prices are available. Therefore, the range of maturities for which yields are available may vary according to the instruments available. 
  • We decided to extend the range of published OIS curve maturities (from 5 to 25 years) in late 2021 as our market contacts reported that the transition away from LIBOR benchmarks towards SONIA had improved liquidity in longer term OIS rates. Prior to this transition, liquidity was said to be relatively limited and for this reason we have chosen not provide archive data for longer-term OIS rates prior to December 2021.

  • The extra data (that is, data beyond the 25-year maturity) has been provided following a number of years of increased issuance of UK government bonds at long maturities. The 40-year maturity has been chosen as the cut-off to maintain consistency along the yield curve. Although bonds with maturities greater than 40 years have been issued, gaps between maturities beyond the 40-year maturity are greater than in other segments of the yield curve. 
  • From time to time we review the data we estimate and publish and may make changes to either as a result of a review. As part of a recent review, the UK government nominal curve was identified as being of broad interest to the public at maturities greater than our previous maturity cut-off (25 years). The extension of the published data for that curve to 40 years is a result of that review.

  • The market for generalised collateral (GC) repo agreements began in January 1996. GC repos became a more satisfactory indicator of expectations of future interest rates after March 1997, when the Bank began conducting its Open Market Operations using gilt repos. Prior to this date the only available short maturity assets we could use would be Treasury bills, which do not have an active secondary market and the prices of which are affected by banks’ liquidity requirements. 

Data updates

  • Yes, revisions will reflect changes in the inclusion of data on different instruments in the underlying calculations. For example, UK real yield data were reviewed in 2017 and data were revised. In that case, the estimation procedure was changed (moving to estimation based on real prices rather than nominal prices) for recent data. See below for more detail. 

    Here we provide more background information relating to the revision, in 2017, of UK real yield estimates published on the Bank of England website. (Data for 2017 were revised in July 2017; data for 2015 and 2016 in October 2017. In both cases the same type of revision was made; it is described below.) 

    • The UK inflation-linked government bond (ILGB) market comprises two types of inflation-linked bond, “old-style” and “new-style”, both linked to the UK Retail Price Index (RPI).
    • The “new-style” ILGBs are linked to inflation with a three-month lag and use interpolated price index levels; the lag in “old-style” ILGBs is eight months and no interpolation is made.
    • When trades in each type of bond are settled, both accrued interest and accrued inflation are factored into the settlement price. But for trading purposes the convention used for prices and yields is not uniform and varies according to the type of the bond.
    • The composition of the market in terms of the two types of bond has changed over time. It is dominated now by the “new-style” type.

    Reflecting this, the 2017 revision of the real yield estimates corresponds to a switch of the price convention used in the fitting procedure from that characteristic of the “old-style” instrument to that of the “new-style” instrument1. Prices of both types of bond continue to be used as inputs in the fitting procedure.

    1 In detail, new-style ILGB prices are quoted in “real, clean” (RC) terms: quoted prices include neither accrued interest nor accrued inflation; old-style ILGB prices are quoted in “nominal, clean” (NC) terms: accrued inflation is included but accrued interest is not. (For the respective yield calculations a formula is used, which is set by the Debt Management Office (DMO) and which varies according to the type of the ILGB, and accrued interest is added to the quoted price, which varies according to the type of the ILGB.)

  • We aim to publish yield curves by noon of the following business day. The site shows when the data were last updated. Monthly data in our archive are available by close of business of the second working day of a month, for example, data for the 31/12/20 will be published by close of business 05/01/21. 
  • If the downloaded spreadsheet does not contain up-to-date data, it is possible this is due to an old version of the page being saved in your cache memory. It is often possible to fix this problem by ensuring that you have refreshed the web-page before downloading the spreadsheet.

Interpreting yield curves

  • In our spreadsheets, the short end of the curve is reported in granular monthly intervals, while the whole curve (including longer maturities) is reported on a separate tab in semi-annual intervals. Within these tabs, curves calculated for particular dates are reported in each row, whilst column headings indicate the maturity point on Each of those curves. Some points on the curve will be duplicated in both tabs, for example the 12 month point will be reported in the short end, but also included in the whole curve (as the 1 year point).
  • The forward rates are instantaneous forwards, so for example the 2y rate in the spreadsheet is the implied instantaneous (i.e the limit as the length of the period goes to zero) rate in 2 years’ time. 

    In terms of additional reading for our yields, the following may be helpful:

    Yield curve terminology and concepts
    New estimates of the UK real and nominal yield curves

     
  • General discussion of yield curve movements can be found in Section 1 of our Monetary policy report, and also in the Markets and Operations section of our Quarterly Bulletin

Yield curve methodology

  • The yields (spot and forward) are continuously compounded and quoted on an annual basis. We do not provide support in transforming these yields into other forms of compounding/quoting or how these should be used for specific applications. 
  • The yields that we quote are derived from a fitted curve (for background information see New estimates of the UK real and nominal yield curves by Nicola Anderson and John Sleath). We provide our yield curve estimates for ease of reference and research purposes, as do other major central banks. While we understand that they might be used for a wide array of purposes, we are unable to provide further support to aide any specific applications.

    We do not currently publicly disclose our code, updated parameter values or specific decisions to include or exclude specific instruments. We do, however, periodically review the amount of information we make publicly available. We review the yield curve derivation methodology on a regular basis and reserve the right to modify, adjust or improve the methodology. 

  • We follow the conventions used in the market. For UK government bonds this has been Actual/Actual since November 1998 and Actual/365 prior to that. For all other instruments the convention is Actual/365. 
  • The Prudential Regulation Authority (PRA) publishes technical information for UK insurance firms subject to Solvency II to calculate technical provisions. The information includes risk-free rate term structures. These differ from the curves published here in a number of ways, so can be expected to differ for the same valuation date. The main differences are summarised in the following table:

      Yield curves Solvency II Technical Information (TI)
    Data source
    Bloomberg
    Refinitiv
    Input data
    Some OIS maturities are excluded on liquidity grounds.
    Only tenors where the market is considered to be Deep, Liquid and Transparent are used in the calculation.
    Fitting methodology
    An adjusted Waggoner method is used to fit a curve to submitted data points. This paper provides more information.
    The Smith-Wilson Technique is used to smooth the forward curve between observations and also from the last observable tenor to the ultimate forward rate.
    Compounding
    The curves are continuously compounded and quoted on an annual basis.
    The figures are annually compounded zero coupon spot rates.
    Further reading
    New estimates of the UK real and nominal yield curves
    Technical information for Solvency II firms
    EIOPA Solvency II

  • The projections for CPI inflation and GDP growth published in the Monetary Policy Report are conditioned on a benchmark path for Bank Rate over the future. This assumes that Bank Rate follows a path implied by a yield curve calculated from certain financial market instruments. 

    Since the August 2009 Inflation Report, the conditioning path has been based exclusively on OIS rates. OIS instruments settle on the Sterling Overnight Index Average (SONIA) rate, which is typically reasonably close to Bank Rate. The market profile is currently constructed as a 15-day average of the instantaneous forward OIS rates that fall in each quarter of the forecast horizon. The market profile observation in the quarter of the Inflation Report’s publication takes into account the level of Bank Rate that has prevailed over that quarter. 

  • Our yields may differ to those of other institutions due to the method of calculation used. The yields that we quote are derived from a fitted curve (for background information see New estimates of the UK real and nominal yield curves by Nicola Anderson and John Sleath). These curves aim to fit relatively smooth implied forward rates. For a comparison of the methods used in major central banks see BIS paper 25 Opens in a new window.
  • Green gilts are not currently included in our gilt yield curve fitting methodology. While similar in terms of structure and payments, the use of the proceeds is limited to green/environmental projects rather than general spending. As such these bonds may attract a premium to invest in relative to conventional gilts with a similar maturity. The inclusion of both types of bond may adversely impact the fitting of the curve. If and when a decision is made to include them we will update the yield curve page with the relevant information.
  • No methodological change has been implemented following the conclusion of the consultation on reform to RPI methodology, published as part of the 2020 Spending Review. The UKSA proposal to align methods and data sources of RPI to CPIH in February 2030 is likely to impact the fitting of the curve around this point.
This page was last updated 20 November 2024